
In today’s #FunctionFriday post we’re going to look at how the SUMIF and SUMIFS functions can be used to build out interactive dashboards like the ones below I just added to my dashboard course for subscribers to apply to their data.
Note: If you want to reanimate the images, just refresh the page with a hard refresh. On a PC use Ctrl-F5 and Command-Shift-R if you’re on a Mac. (I hate animated gifs that automate ad infinitum.)
Excel File Download
I don’t share the whole dashboard, but I share a portion, so you can see how I used both the SUMIF and SUMIFS functions in a single formula to make the drop-down at the top of the dashboard update the entire dashboard.
Here is what the formula looks like that you’ll be learning to rock. Call it a formula BOGO deal. 🙂 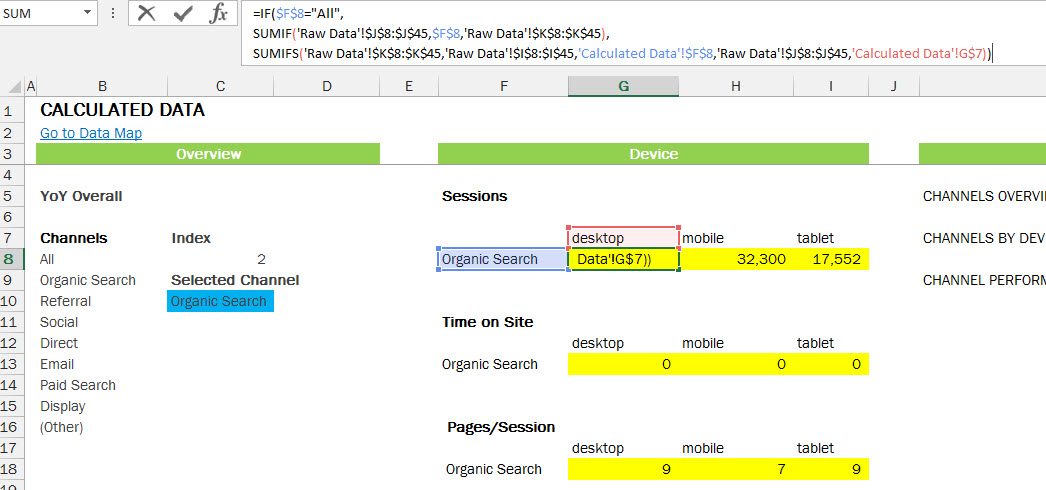 Members of the Annielytics Dashboard Course will have full access to the dashboard, as well as directions for how to update it with your analytics data. Or you could buy it for $795 and have my team update it with your data and colors/branding. It would require a subscription to Analytics Canvas, which you can get for $49/mo for one user. Having tried most of the API tools for Google Analytics, I found Analytics Canvas to have, by far, the most flexibility, especially if you’ve screwed up your campaign tagging. (It allows you to rewrite this data.)
You can download the Excel file to follow along.
Video
Warning: I have a habit of saying formula when I mean function. Formulas are made up of individual functions, such as the SUMIF and SUMIFS functions.
Great post
Thanks a lot really you taught me awesome excel formulas
Wonderful! Happy to help. 🙂
VERY GOOD …..I NEED YOU HELP